Server load notifications
What kind of server load notifications can I subscribe to and what actions do I need to take?
Many cores are full in use
To investigate where a high load comes from on a dedicated hipex server, you can do the following.
Go to the monitoring overview in pack to check what is causing the load.
In this overview you select the desired server and the time period in which the server was overloaded.
This screenshot shows the network traffic from the server.
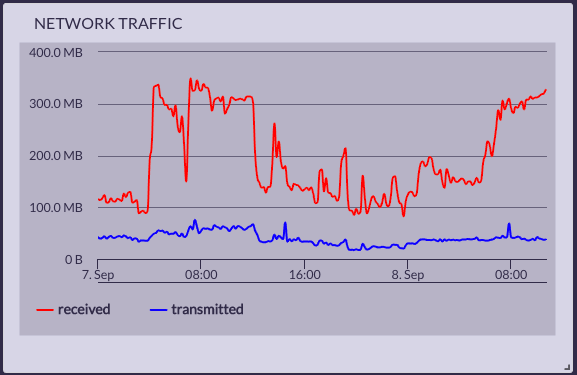
As can be seen above, the load is indeed caused by receiving a lot of traffic.
Now we are going to logging to the server to check why there are made so many connections.
When you are logged in under the SSH user go to the following folder: ~/domains/<domain_name>/var/log
Here you can use a "GoAccess" to request exactly where the requests come from and at which url they arrive. In this command you can also filter by the time when the peak moment was:
cat *.nginx.access.log | grep -P '8/Sep/2021:0[234]:' | grep -vP '(static|media)' | goaccess --log-format=COMBINEDBy adjusting the timestamp you can specify exactly which hours should be read, for example. As stated above, all requests on 8 September are read between 2 and 4 am.
After this you will get a specific overview with the pages where the most requests have come in:
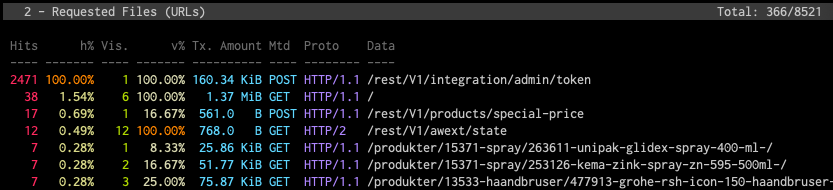
Above, for example, you can see that an enormous number of requests have been received on /rest. This is the import api of magento and in this example will be the overload caused by an import on this environment.
Server load is busy
To investigate where a high load comes from on a dedicated hipex server, you can do the following.
Go to the monitoring overview in pack to check what is causing the load.
In this overview you select the desired server and the time period in which the server was overloaded.
This screenshot shows the network traffic from the server.
As can be seen above, the load is indeed caused by receiving a lot of traffic.
Now we are going to logging to the server to check why there are made so many connections.
When you are logged in under the SSH user go to the following folder: ~/domains/<domain_name>/var/log
Here you can use a "GoAccess" to request exactly where the requests come from and at which url they arrive. In this command you can also filter by the time when the peak moment was:
cat *.nginx.access.log | grep -P '8/Sep/2021:0[234]:' | grep -vP '(static|media)' | goaccess --log-format=COMBINEDBy adjusting the timestamp you can specify exactly which hours should be read, for example. As stated above, all requests on 8 September are read between 2 and 4 am.
After this you will get a specific overview with the pages where the most requests have come in:
Above, for example, you can see that an enormous number of requests have been received on /rest. This is the import api of magento and in this example will be the overload caused by an import on this environment.
Server load is full in use
To investigate where a high load comes from on a dedicated hipex server, you can do the following.
Go to the monitoring overview in pack to check what is causing the load.
In this overview you select the desired server and the time period in which the server was overloaded.
This screenshot shows the network traffic from the server.
As can be seen above, the load is indeed caused by receiving a lot of traffic.
Now we are going to logging to the server to check why there are made so many connections.
When you are logged in under the SSH user go to the following folder: ~/domains/<domain_name>/var/log
Here you can use a "GoAccess" to request exactly where the requests come from and at which url they arrive. In this command you can also filter by the time when the peak moment was:
cat *.nginx.access.log | grep -P '8/Sep/2021:0[234]:' | grep -vP '(static|media)' | goaccess --log-format=COMBINEDBy adjusting the timestamp you can specify exactly which hours should be read, for example. As stated above, all requests on 8 September are read between 2 and 4 am.
After this you will get a specific overview with the pages where the most requests have come in:
Above, for example, you can see that an enormous number of requests have been received on /rest. This is the import api of magento and in this example will be the overload caused by an import on this environment.
Performance measures
Monitor the situation and wait
It could be that the load will automatically degrade over time and go back to "normal". Traffic spikes and server heavy operations caused by your application, can result in temporary load spikes on the server without any real issues, but just enough to trigger load warning notifications. In this cases, monitoring the situation and being patience can be enough without the need to kill processes or other impactful measures.
If you suspect your application contains memory leaks or other performance bottlenecks, use application monitoring tooling like New Relic for further application performance analysis and insights.
Kill pending PHP requests and restart PHP processes
IMPORTANT Keep in mind that you should only use those commands when you are sure that running PHP processes are causing issues. Never just blindly kill PHP processes without knowing what you're doing, as it can potentially harm your application and it's users.
Sometimes it's neccesary to kill all pending PHP requests and restart all PHP processes. We can do this using the following Hipex CLI commands:
hipex restart:php
hipex restart:phpfpm
Kill all running MYSQL queries
IMPORTANT Keep in mind that you should only use those commands when you are sure that running MYSQL queries are causing issues. Never just blindly kill MYSQL queries without knowing what you're doing, as it can potentially harm your application and it's users.
Database queries sometimes get stuck or deadlocked. In this case, the Hipex CLI can be utilized to kill all running queries:
hipex restart:mysqlKill all running bin/magento processes
Sometimes the application can't be reached because of too many running cronjobs. When you are not using the hipex cronjobs, new crons will start even if the old ones are not done yet. This will result in a lot of memory usage, and could slow down your application.
If this is the case, it might be better to kill running crons using the following command:
kill $(ps aux | grep '[b]in/magento' | awk '{print $2}')