Testing
How to test the behaviour of the Percolate Pagespeed Optimizer.
Why you need to test
After Percolate has been installed and configured for your application, it's important do a functional test in order to prove that:
- Percolate is configured and optimized correctly.
- All resources can be optimized.
- Your application functions the same with and without Percolate.
- Your application performs better with Percolate activated compared to without.
- Percolate will be purged (direct or delayed) after the application cache has been cleaned.
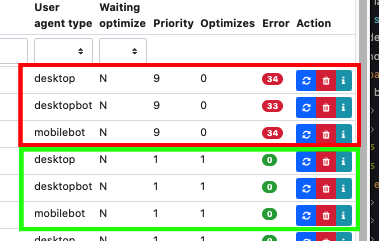
Verifying the resource optimization status on the Percolate status page
When Percolate is installed and configured correctly, you can find a list of all resources that will and have been optimized on the Percolate status page: yourapplication.com/.percolate/status.
If all listed resources have been optimized succesfully, they will show at least 1 at optimize counter, and won't show any errors on the error counter.
The following image shows two different resources, both optimized for 3 different user agents:
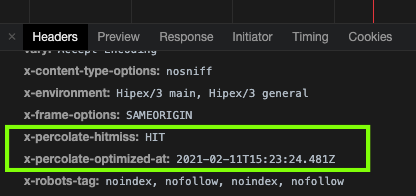
Inspecting the Percolate HTTP response headers
Percolate comes with two response headers that can be inspected in order to verify if a requested URL has been optimized by Percolate and served by the proxy: x-percolate-hitmiss and x-percolate-optimized-at, with the latter indicating the timestamp of the actual performed optimization.
The following image shows a Chrome DevTools fragment, indicating that the url has been optimized and served by Percolate succesfully:
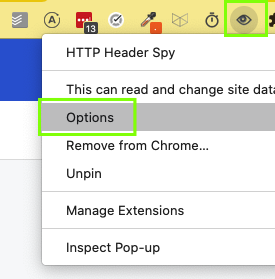
Automate Percolate headers inspection with a Chrome extension
The Chrome extension HTTP Header Spy makes it easy to automatically show small messages with response information in the bottom right of your browser after every request.
You can configure this extension to include the Percolate HTTP response headers. This will help you with testing and validating if a page is being optimized and served correctly by Percolate.
To configure the extension, use the following steps:
1. Download HTTP Header Spy Chrome extension
Download it from the Chrome Web Store
2. Open HTTP Header Spy extension options
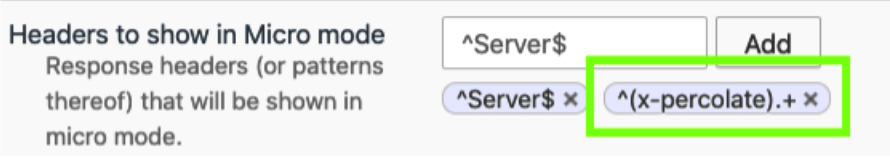
3. Add Percolate headers pattern
In the "Headers to show in Micro mode" section, add ^(x-percolate).+ as pattern.
This will include all the Percolate headers, always starting with x-percolate.
4. Validate if Percolate headers are shown
Now the extension is configured, you'll see temporary "micro messages" in the bottom right of your browser after every page visit.
Examples:
MISS: Placed in queue

HIT

Verifying if the application looks and behaves the same with versus without Percolate
Every url of your application can be appended with querystring paramater ?nocache=1 in order to force the Percolate proxy to serve the original resource instead of the optimized resource. This enables you to test and compare the look and feel of your page, and you can use it to compare both versions of a page with web performance testing tools like PageSpeed Insights or GTmetrix.